
Fast Robots - Lab 9: Mapping
Prelab
The goal of this lab was to use sensor data and transformation matrices in order to create a map our external enviornment using a distance sensor from a fixed position, allowing only rotation.
PID Wrap
When making my Angular PID controller dur lab 5, I had a great deal of problems when I would cross the +180 to -180 threshold. First, I altered my PID logic to accomodate for this case better.
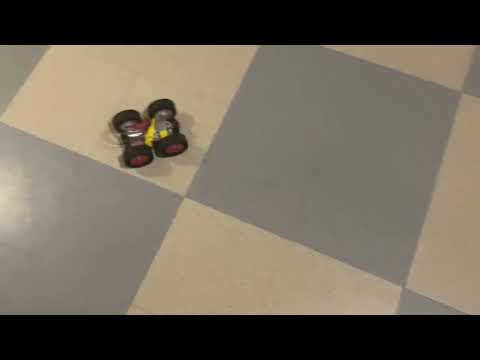
Figure 1: Angular PID with wrap control video
Control
I took my Angular PID controller and had it run constantly in the background as it approaches my target angle. After successfully reading my target angle 3 times in a row, I would begin collecting data. I set this success threshold to mitigate situation where I may reach my target, but travel past due to inertia. Through testing, I found 3 consecutive successes to work very well.
After confirming my target angle, I then collect time, yaw, and ToF data 5 times. After this I reset the success counter and increment my new target angle by 10 degrees. With a new target I then repeat the process again.
An additional change I made compared to my initial angular PID was to start polling with the DMP early. I found my first second or so of DMP data would always be noisy, thus I added a delay to let the DMP stabilize before allowing the PID control to act on this data.
    case MAP:{
      Serial.println("START MAP CASE");

        icm_20948_DMP_data_t data;
        myICM.readDMPdataFromFIFO(&data);
        delay(2000);
        int count = 0;
        int distance = 0;
        int target = 0;
        int pwm = 0;
        int dir = 0;
        int err = 0;
        int errI = 0;
        int errP = 0;
        int errD = 0;
        int success= 0;

        float pid_dt = 0;
        memset(time_array, 0, sizeof(time_array));
        memset(yaw_array, 0, sizeof(yaw_array));
        memset(PWM_array, 0, sizeof(PWM_array));
        memset(err_array, 0, sizeof(err_array));
        memset(TOF_array, 0, sizeof(TOF_array));
        memset(target_array, 0, sizeof(target_array));

        prevMillisTOF= millis();
        currMillisTOF= millis();
        unsigned long t1=millis();
        unsigned long t2=millis();


        /////////////////////////////////// dmp loop
        while ((currMillisTOF - prevMillisTOF <= 10000) && (count <= Array_Size)) {
          icm_20948_DMP_data_t data;
          myICM.readDMPdataFromFIFO(&data);

          Serial.println("Looping . . . ");

          if ((myICM.status == ICM_20948_Stat_Ok) || (myICM.status == ICM_20948_Stat_FIFOMoreDataAvail))  // Was valid data available?
          {
            if ((data.header & DMP_header_bitmap_Quat6) > 0)  // We have asked for GRV data so we should receive Quat6
            {

              double q1 = ((double)data.Quat6.Data.Q1) / 1073741824.0;  // Convert to double. Divide by 2^30
              double q2 = ((double)data.Quat6.Data.Q2) / 1073741824.0;  // Convert to double. Divide by 2^30
              double q3 = ((double)data.Quat6.Data.Q3) / 1073741824.0;  // Convert to double. Divide by 2^30

              double q0 = sqrt(1.0 - ((q1 * q1) + (q2 * q2) + (q3 * q3)));

              double qw = q0;  // See issue #145 - thank you @Gord1
              double qx = q2;
              double qy = q1;
              double qz = -q3;

              double t3 = +2.0 * (qw * qz + qx * qy);
              double t4 = +1.0 - 2.0 * (qy * qy + qz * qz);
              double yaw = atan2(t3, t4) * 180.0 / PI;
              ////////////////////////////////////////////////////////////////////////////////PID CONTROL+
              //time_array[count] = millis();
              //yaw_array[count] = (float)yaw;
              t1=t2;
              t2=millis();
              //pid_dt = time_array[count] - time_array[count - 1];
              pid_dt= t2-t1;
              errP = (float)(yaw - target);
              errI = (float)errI + errP * pid_dt / 1000;
              //errI=0;
              if (errI > 150) {
                errI = 150;
              } else if (errI < -150) {
                errI = -150;
              }
              err = (float)errP + errI;
              pwm = (int)(kp_a * errP) + (ki_a * errI);

              if (err > 0) {
                //turn clock wise
                dir = 1;
                Serial.print(" clockwise    ");

              }

              else if (err < 0) {
                //turn c clockwise
                dir = (-1);
                Serial.print(" counter clockwise    ");
              }
              Serial.println(dir);

              pwm = abs(pwm);

              if (pwm < pwmMinA) pwm = pwmMinA;
              if (pwm > pwmMax) pwm = pwmMax;

              if (abs(err) < (3)) {
                pwm = 0;
                success=success++;
                // Serial.print("success: ");
                // Serial.println(success);
              }

              // collect data at each new spot
              if ((success >= 3)){
                turn(0, 0);
                success=0;
                delay(100);
                for (int d=1; d<=5; d++){
                distanceSensor1.startRanging();

                    while(!distanceSensor1.checkForDataReady()){
                      delay(1);
                    }

                  Serial.print("tof: ");
                  distance = distanceSensor1.getDistance();
                  distanceSensor1.clearInterrupt();
                  distanceSensor1.stopRanging();
                  Serial.print(distance);


                  time_array[count] = millis();
                  yaw_array[count] = (float)yaw;
                  TOF_array[count] = distance;

                  count=count++;
                }

                // success=0;
                if(target <= 170){
                  target=target+10;

                }
                else{
                  target=-180;
                }
              }
              turn(dir, pwm);
            }
            }

          if (myICM.status != ICM_20948_Stat_FIFOMoreDataAvail)  // If more data is available then we should read it right away - and not delay
          {
            delay(10);
          }
          currMillisTOF=millis();
        }

        turn(0,0);

        for (int i = 0; i < count; i++) {
          tx_estring_value.clear();
          tx_estring_value.append(time_array[i]);
          tx_estring_value.append(" | ");
          tx_estring_value.append(yaw_array[i]);
          tx_estring_value.append(" | ");
          tx_estring_value.append(TOF_array[i]);
          tx_characteristic_string.writeValue(tx_estring_value.c_str());
        }
      break;
    }
Figure 2: PID Increment code
This code uses a helper function for turning. This function utilizes a calibration factor to ensure the robot turns about it’s center axis:
void turn(int dir, int PWM) {
  if (dir == 1) {
    //turn clockwise
    analogWrite(motor1a, 0);
    analogWrite(motor1b, int(PWM * cal));
    analogWrite(motor2a, 0);
    analogWrite(motor2b, PWM);

  } else if (dir == -1) {
    //turn counter clockwise
    analogWrite(motor1a, int(PWM * cal));
    analogWrite(motor1b, 0);
    analogWrite(motor2a, PWM);
    analogWrite(motor2b, 0);

  } else {
    //stop
    analogWrite(motor1a, 0);
    analogWrite(motor1b, 0);
    analogWrite(motor2a, 0);
    analogWrite(motor2b, 0);
  }
}
Figure 3: Turn Helper Function
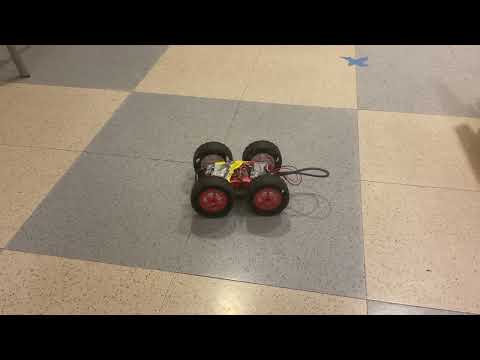
Figure 4: Video of PID control with pause for data collection
Upon implementing my code, I ended up changing my initial target to -180, and then incremented +10 degrees every time to +180 degrees.
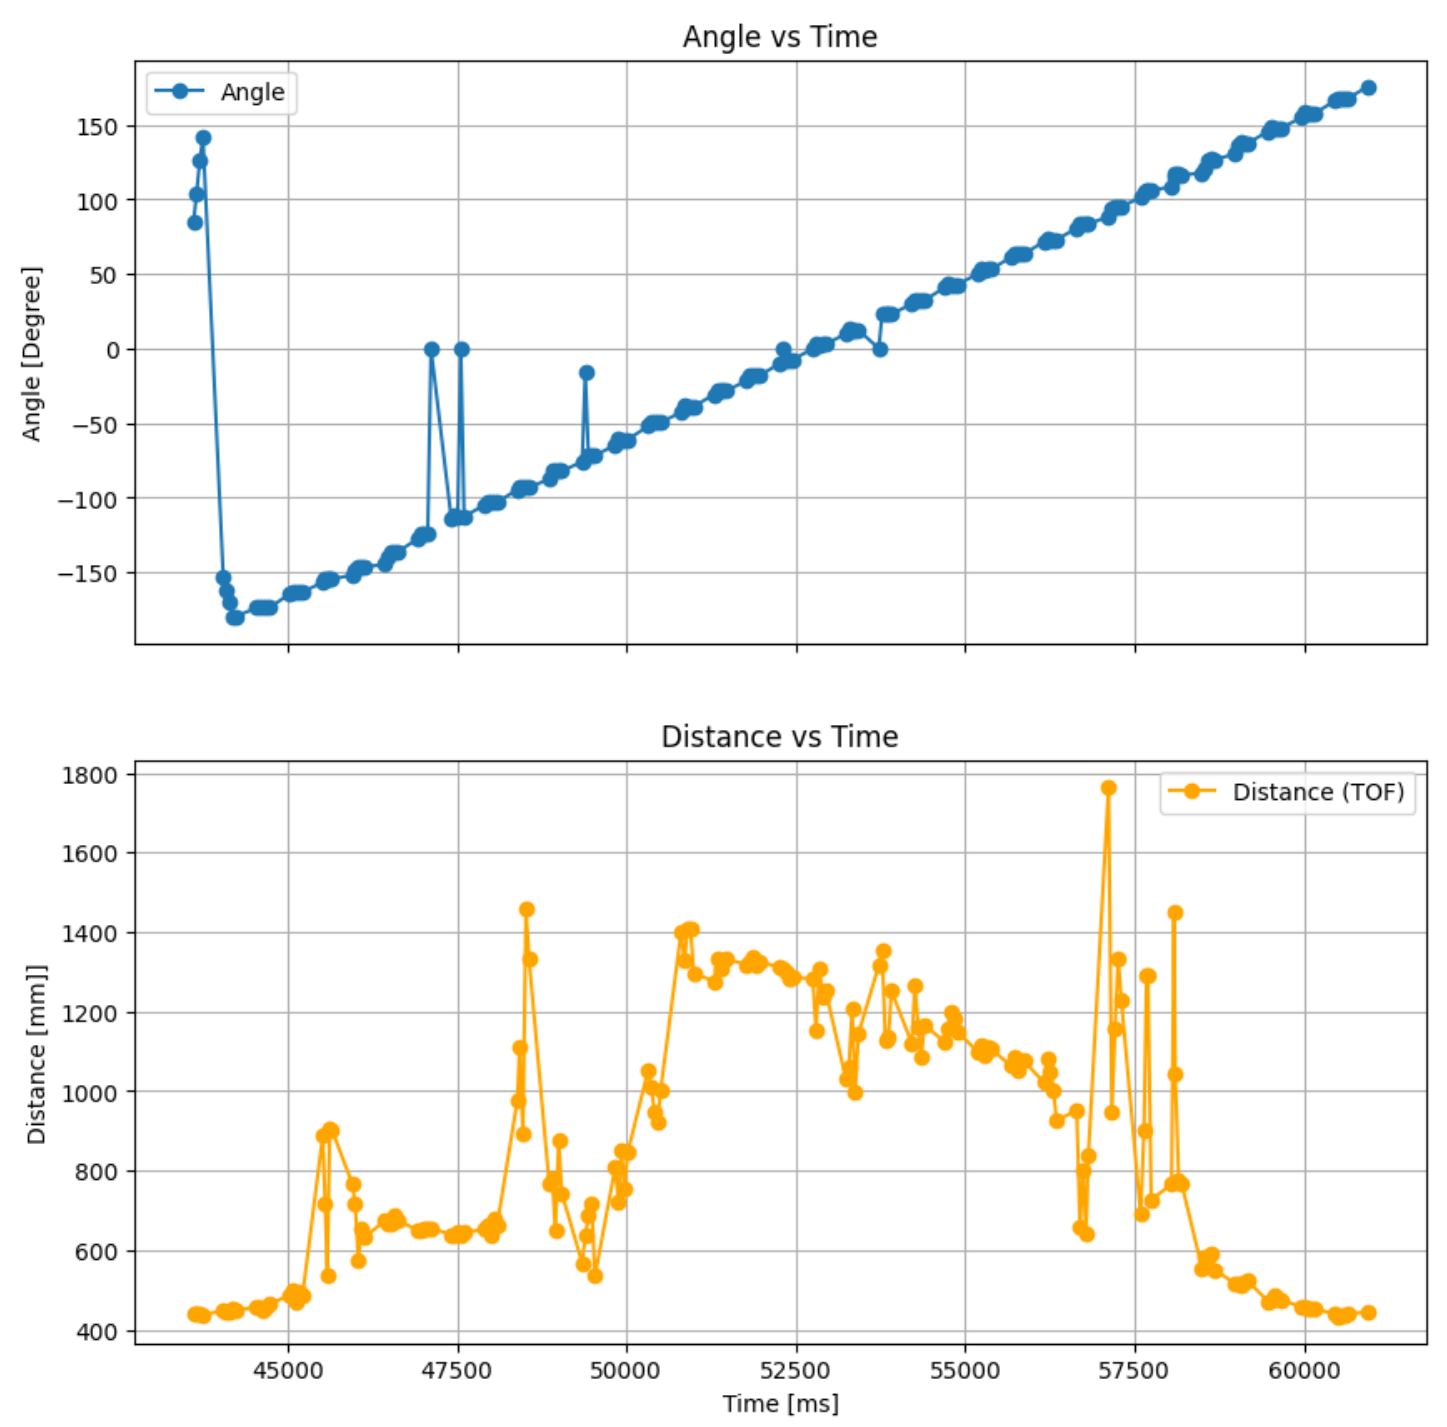
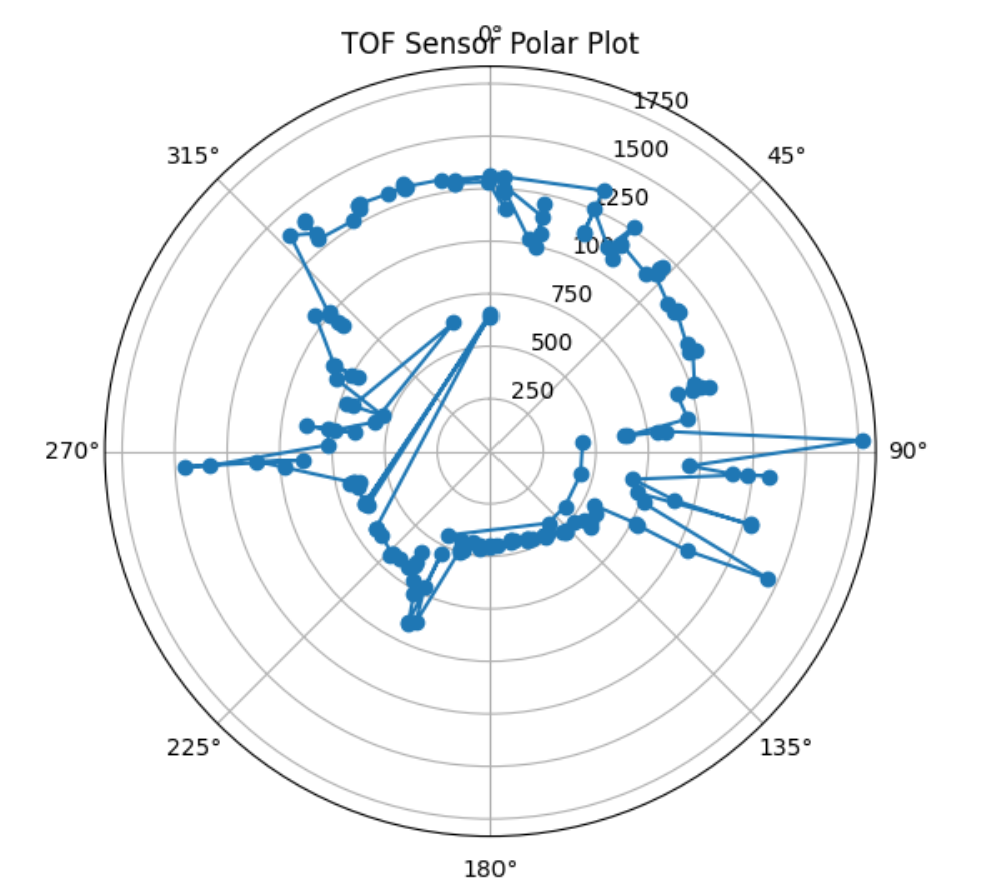
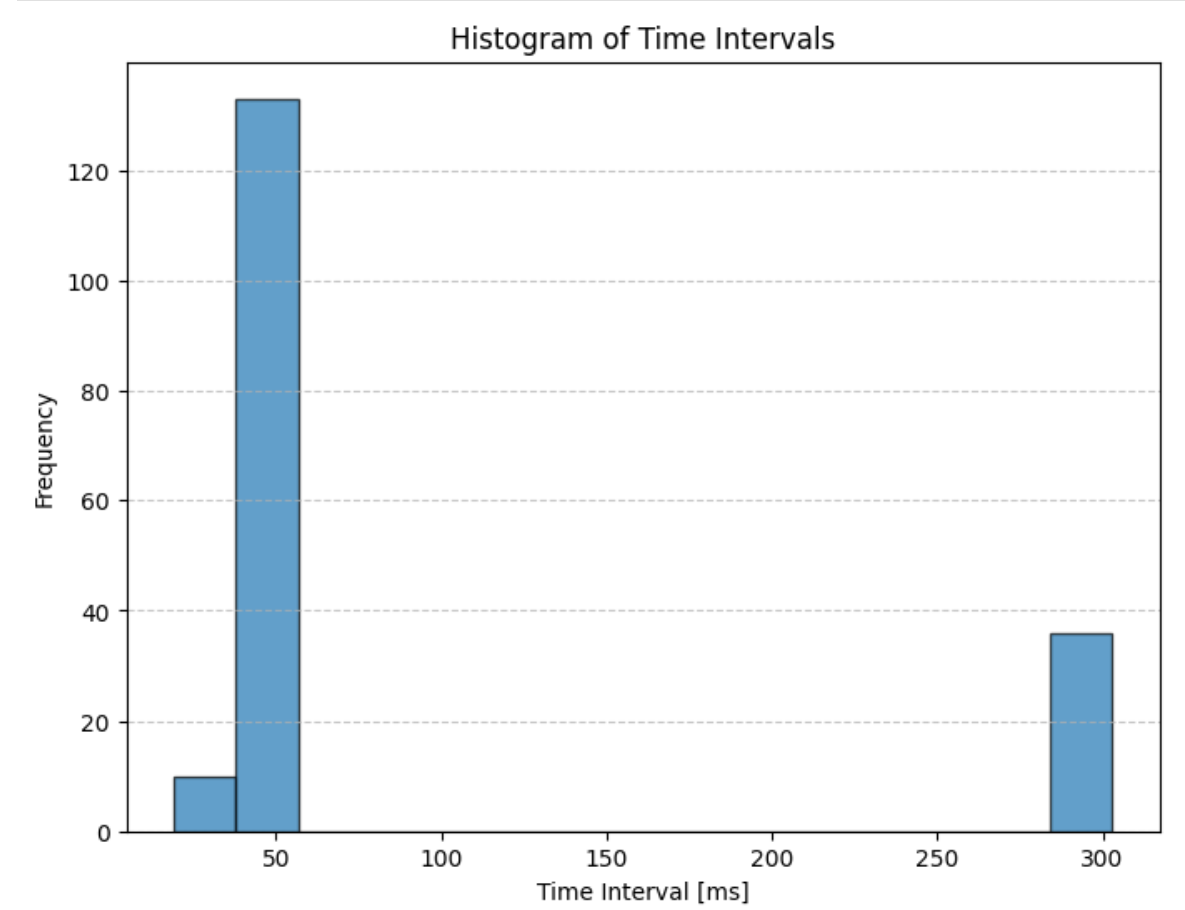
Figure 5,6,7: Test PID Behavior and data rate
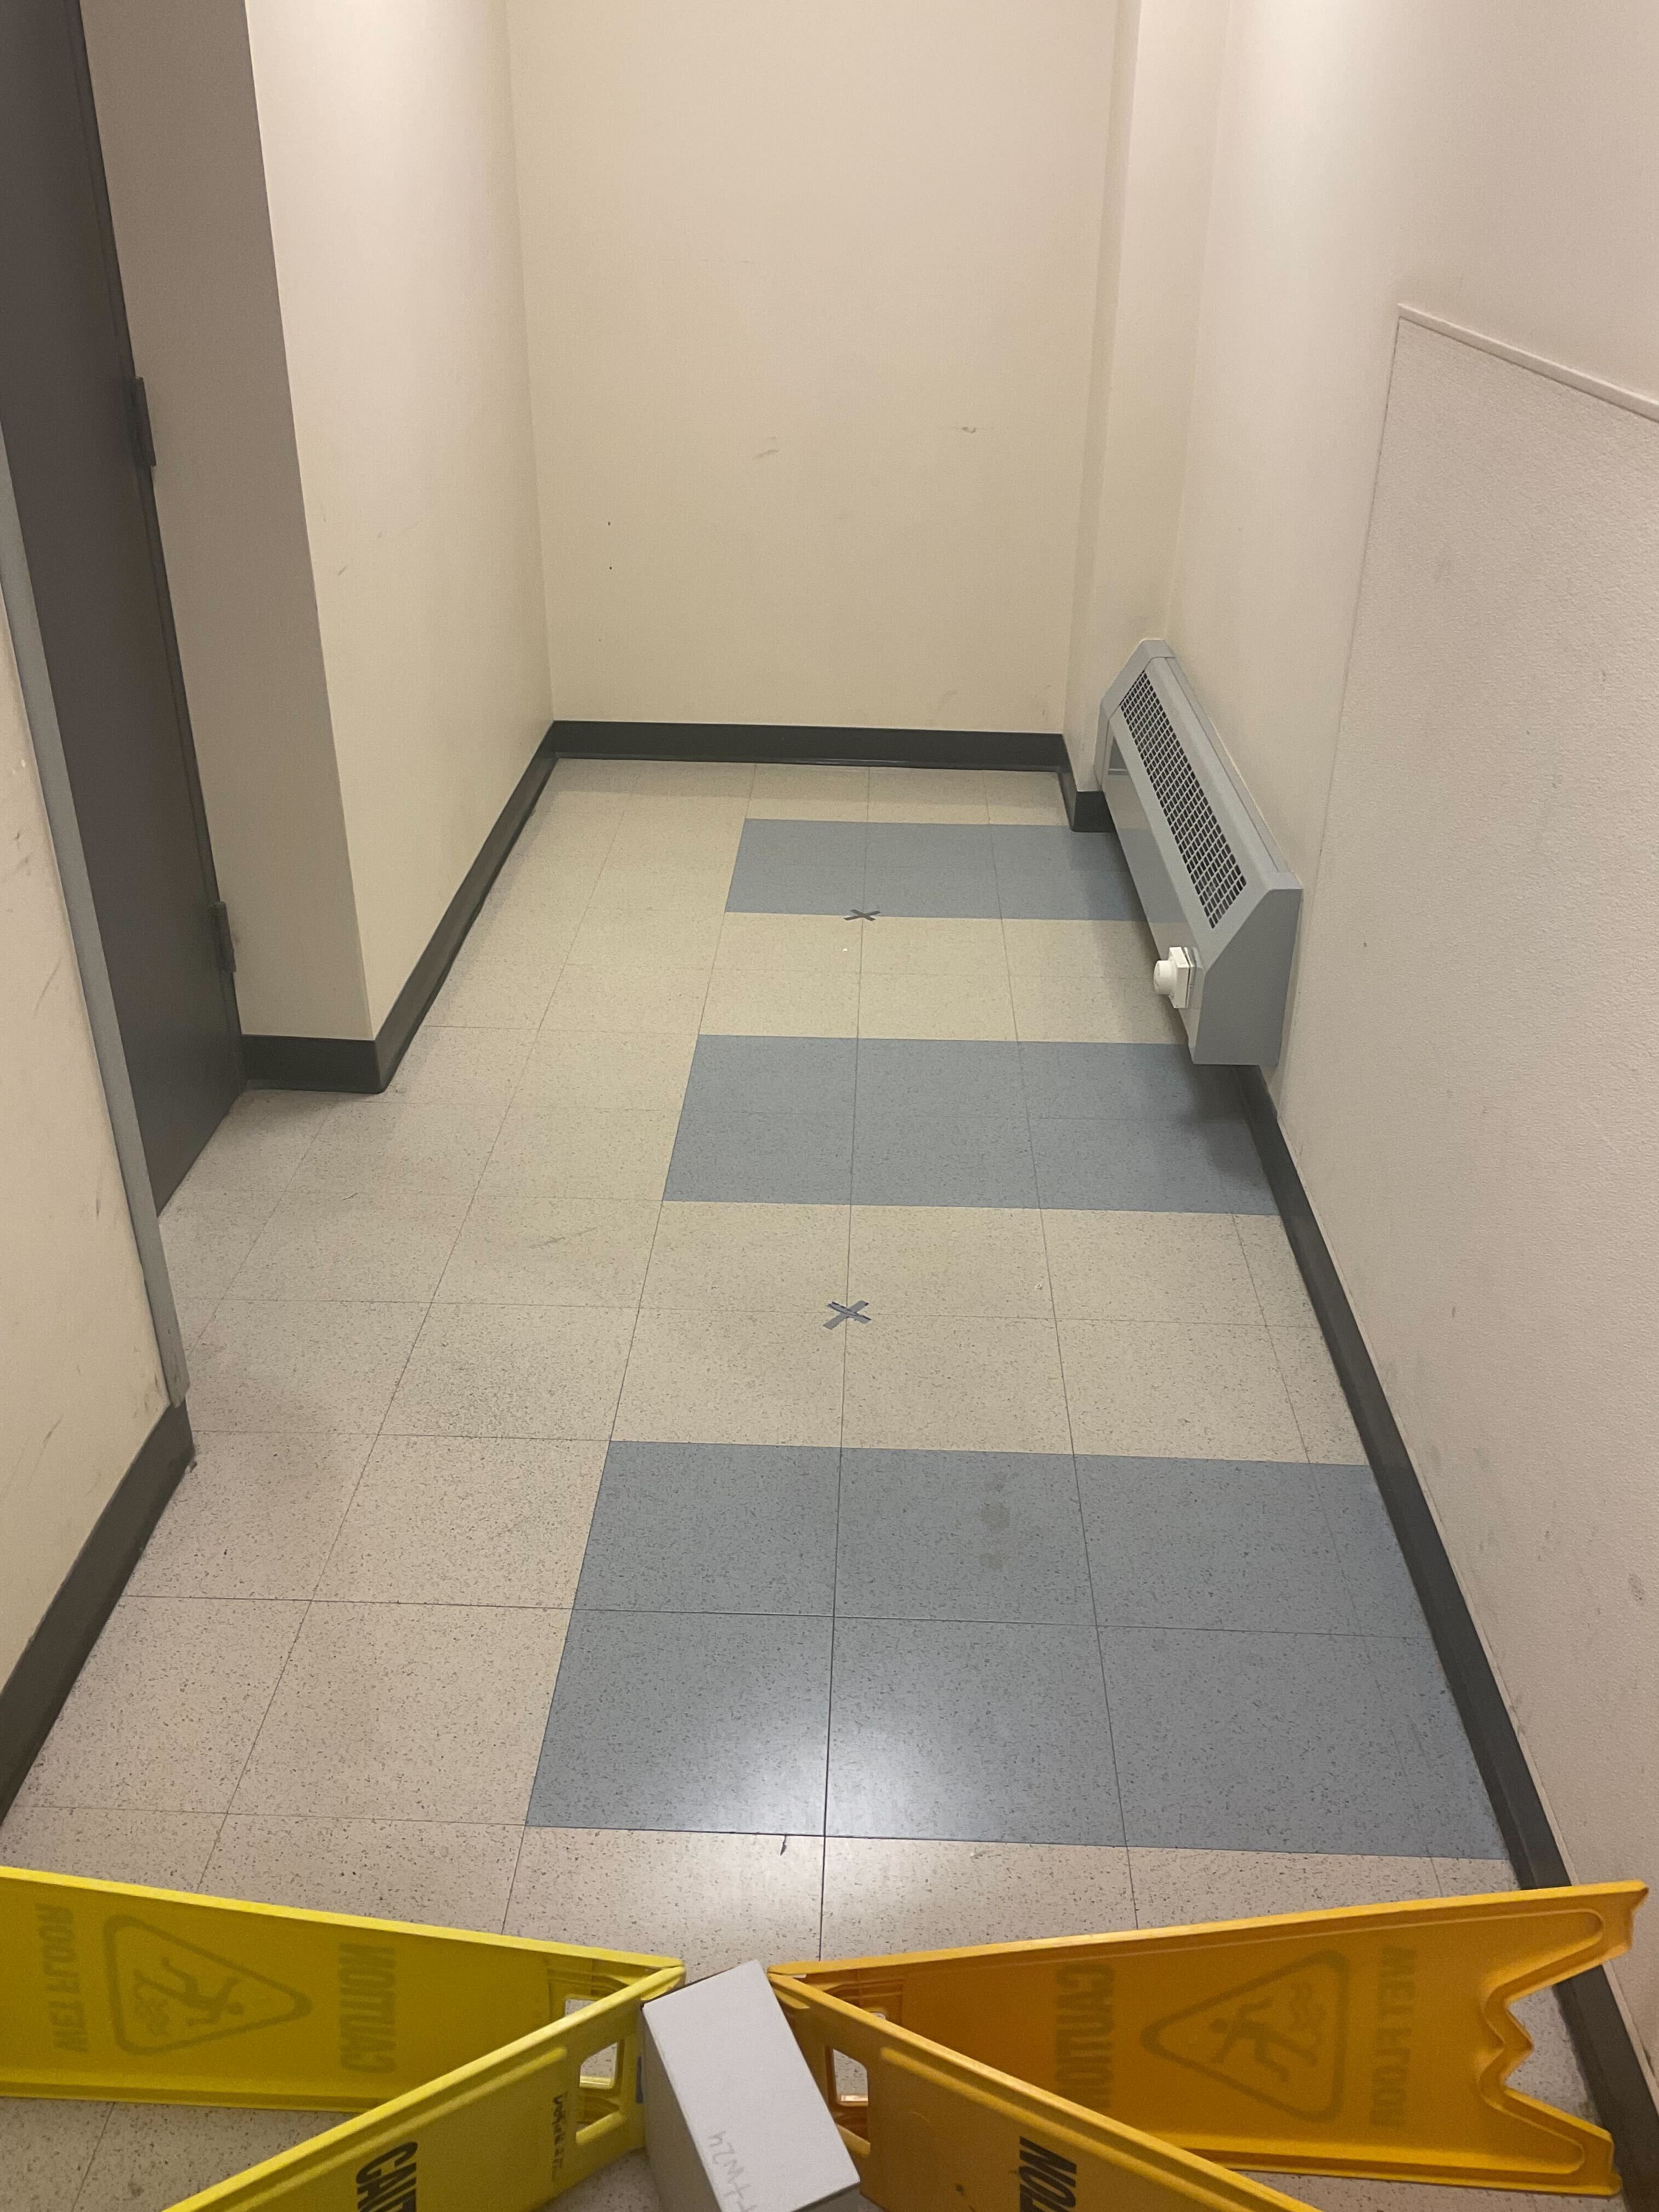
Figure 8: test location
I was unable to attend office hours and record a run in the lab space. Thus I used the Hallway in Phillips Hall 2nd floor. I plan on retrying my code in lab tomorrow.
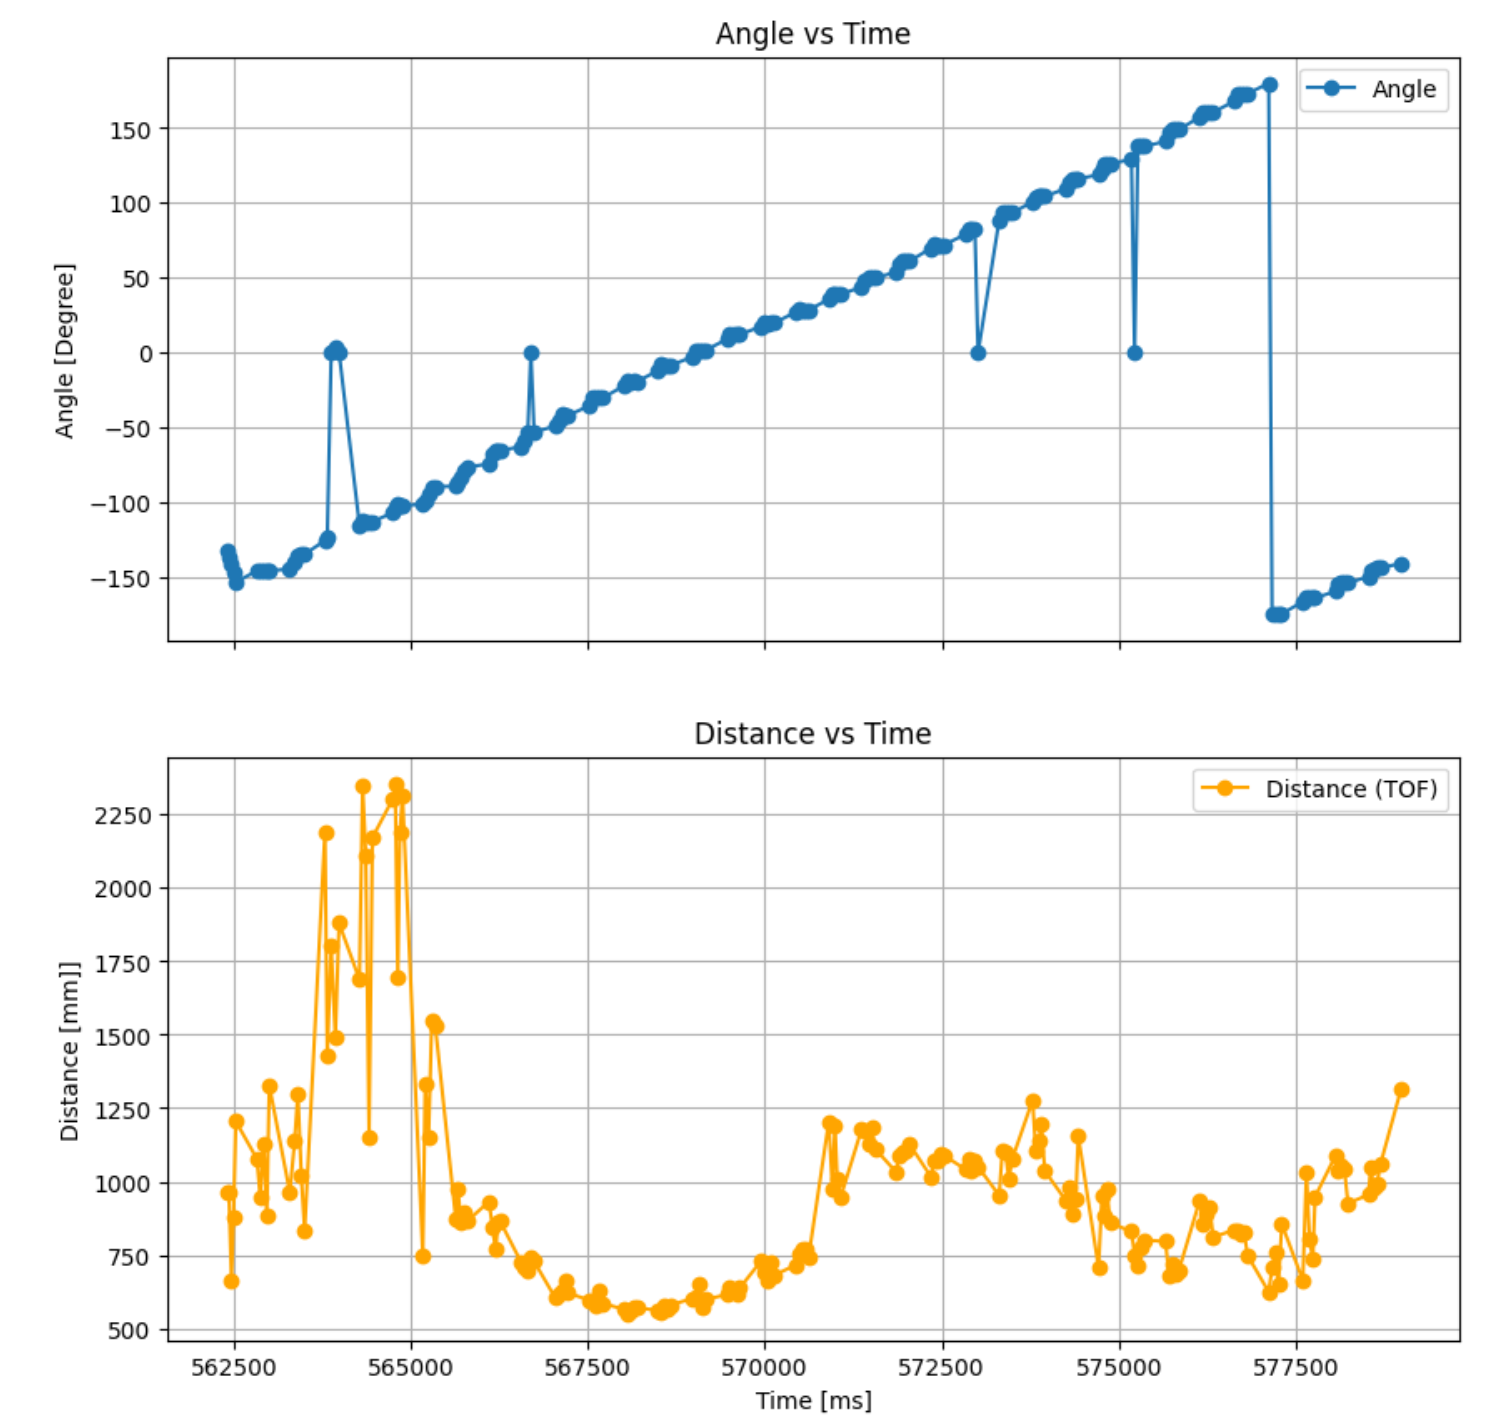
Figure 9: Data Collection 1
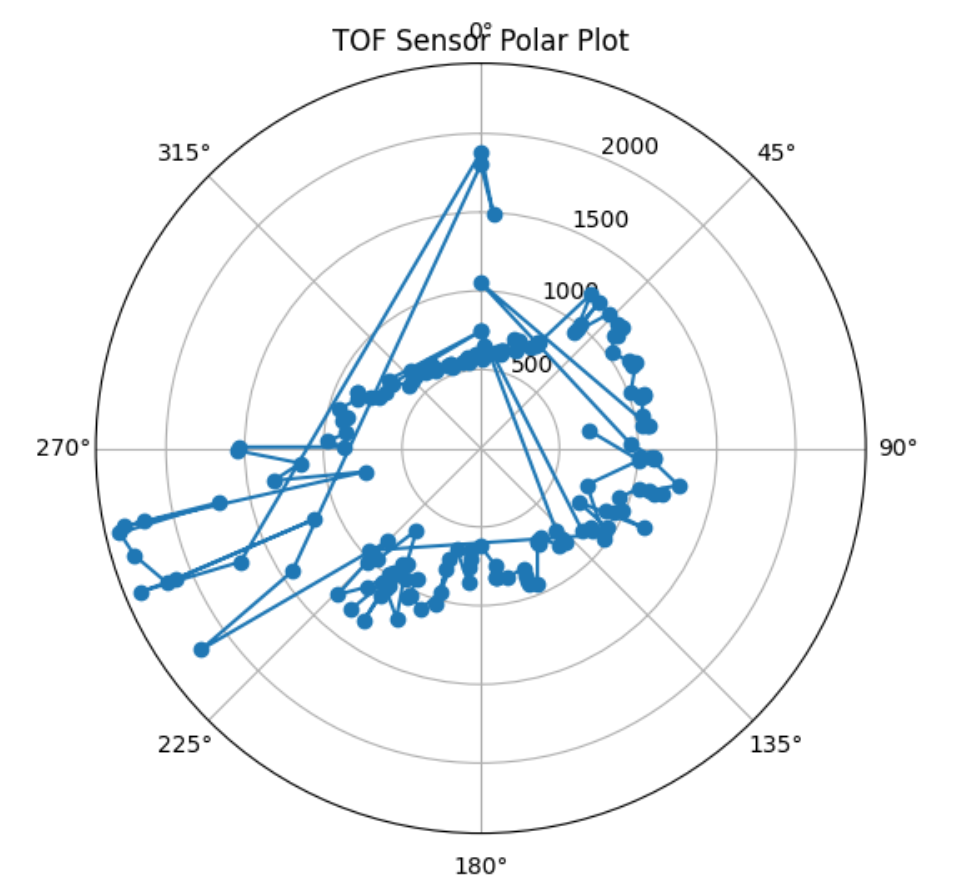
Figure 10: Data Collection 2
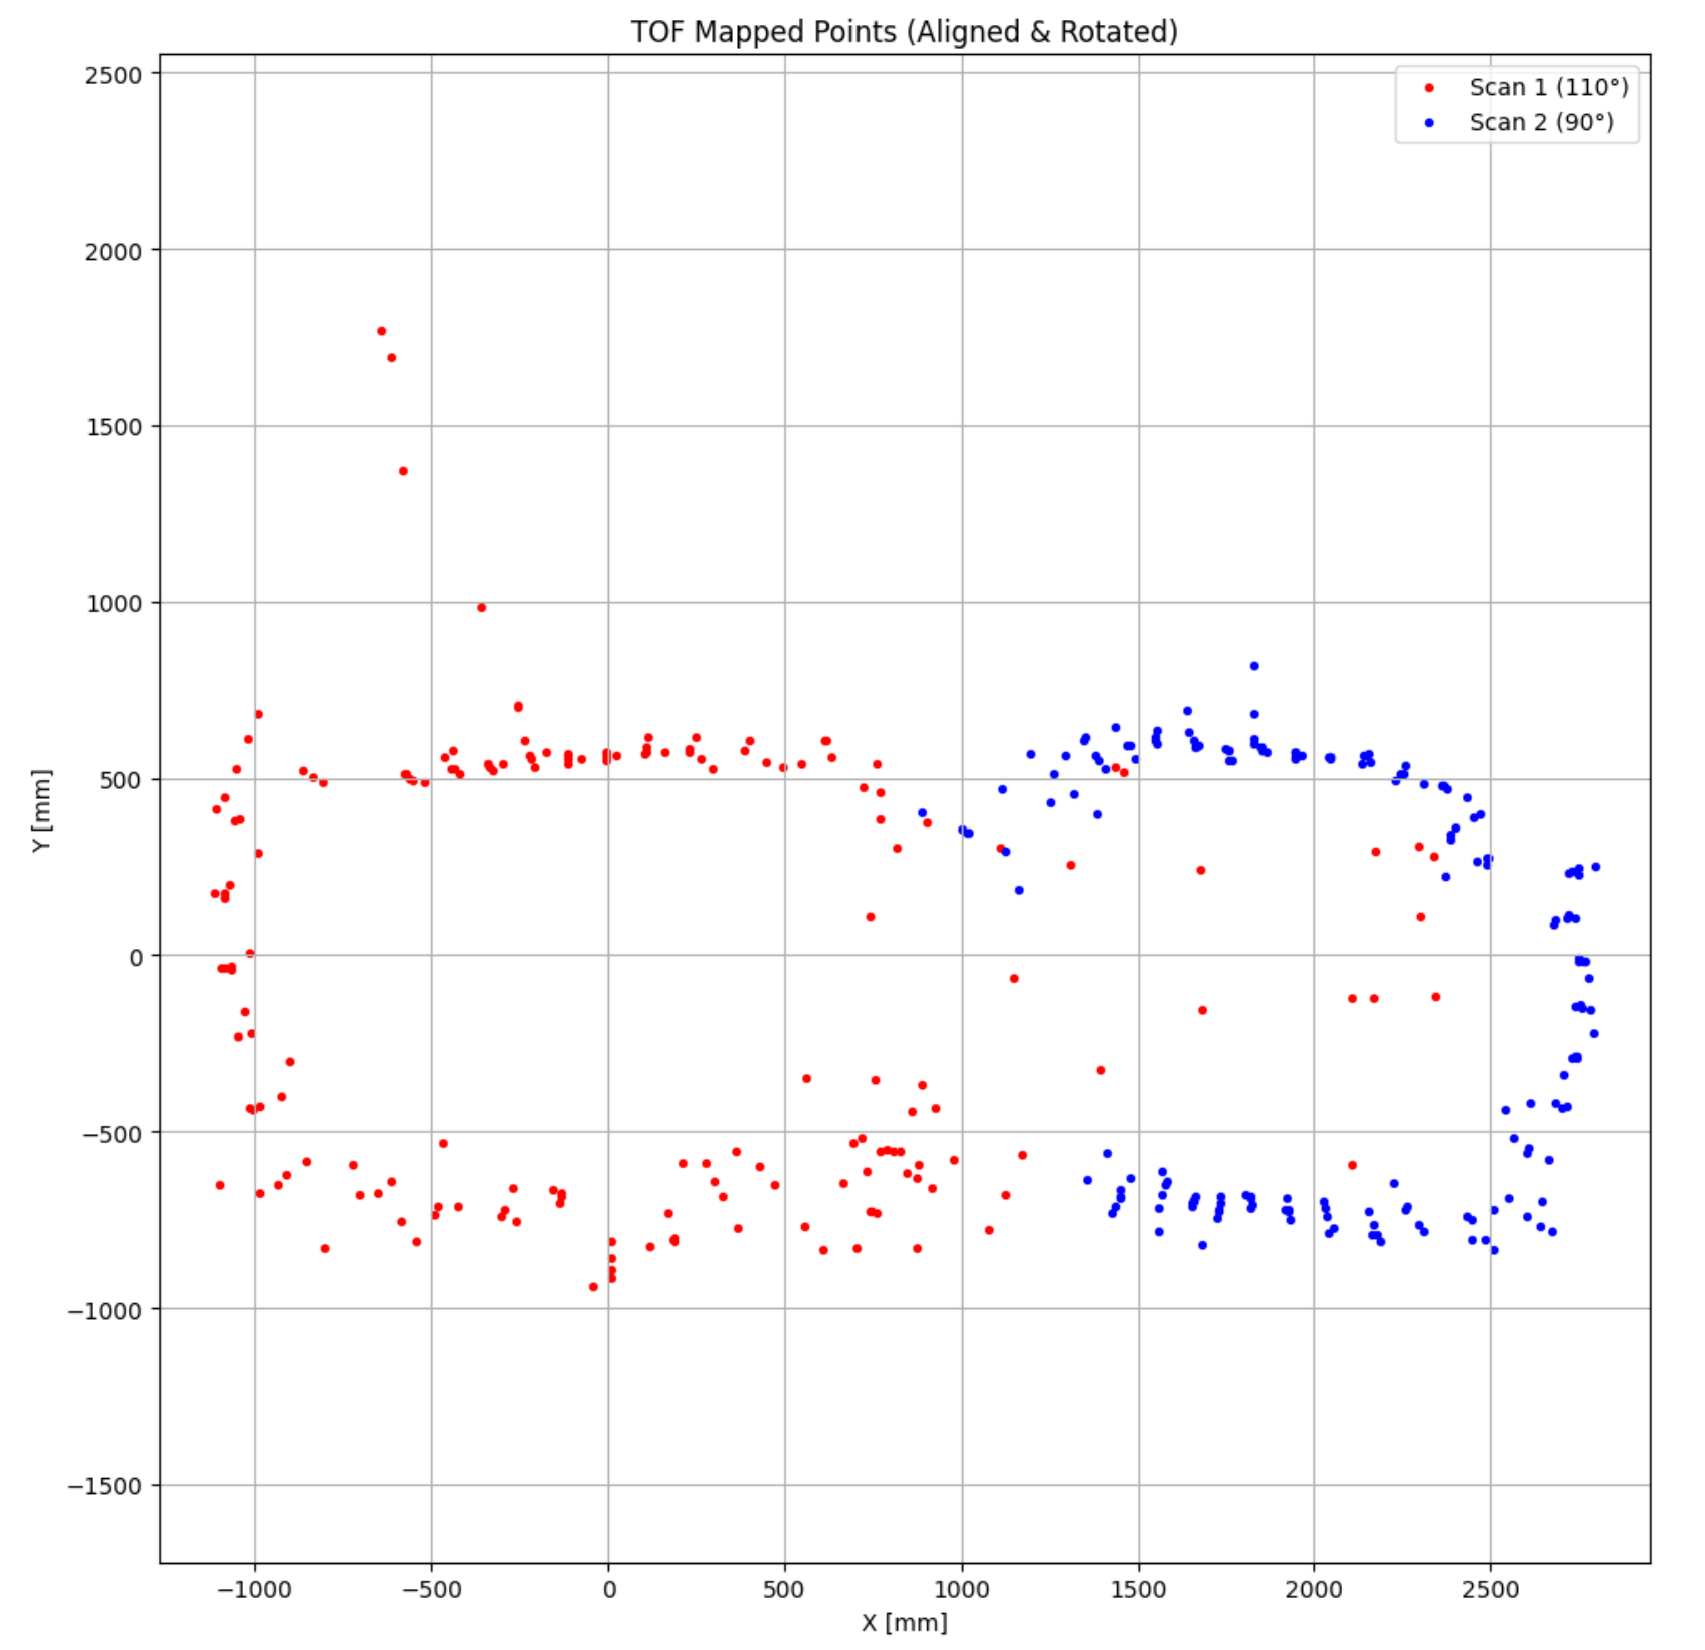 Figure 11: Mapped Scatterplot
After transforming all both data sets, I combined them into a single map. Cross referencing with the above photo, the room becomes very visible.
Figure 11: Mapped Scatterplot
After transforming all both data sets, I combined them into a single map. Cross referencing with the above photo, the room becomes very visible.
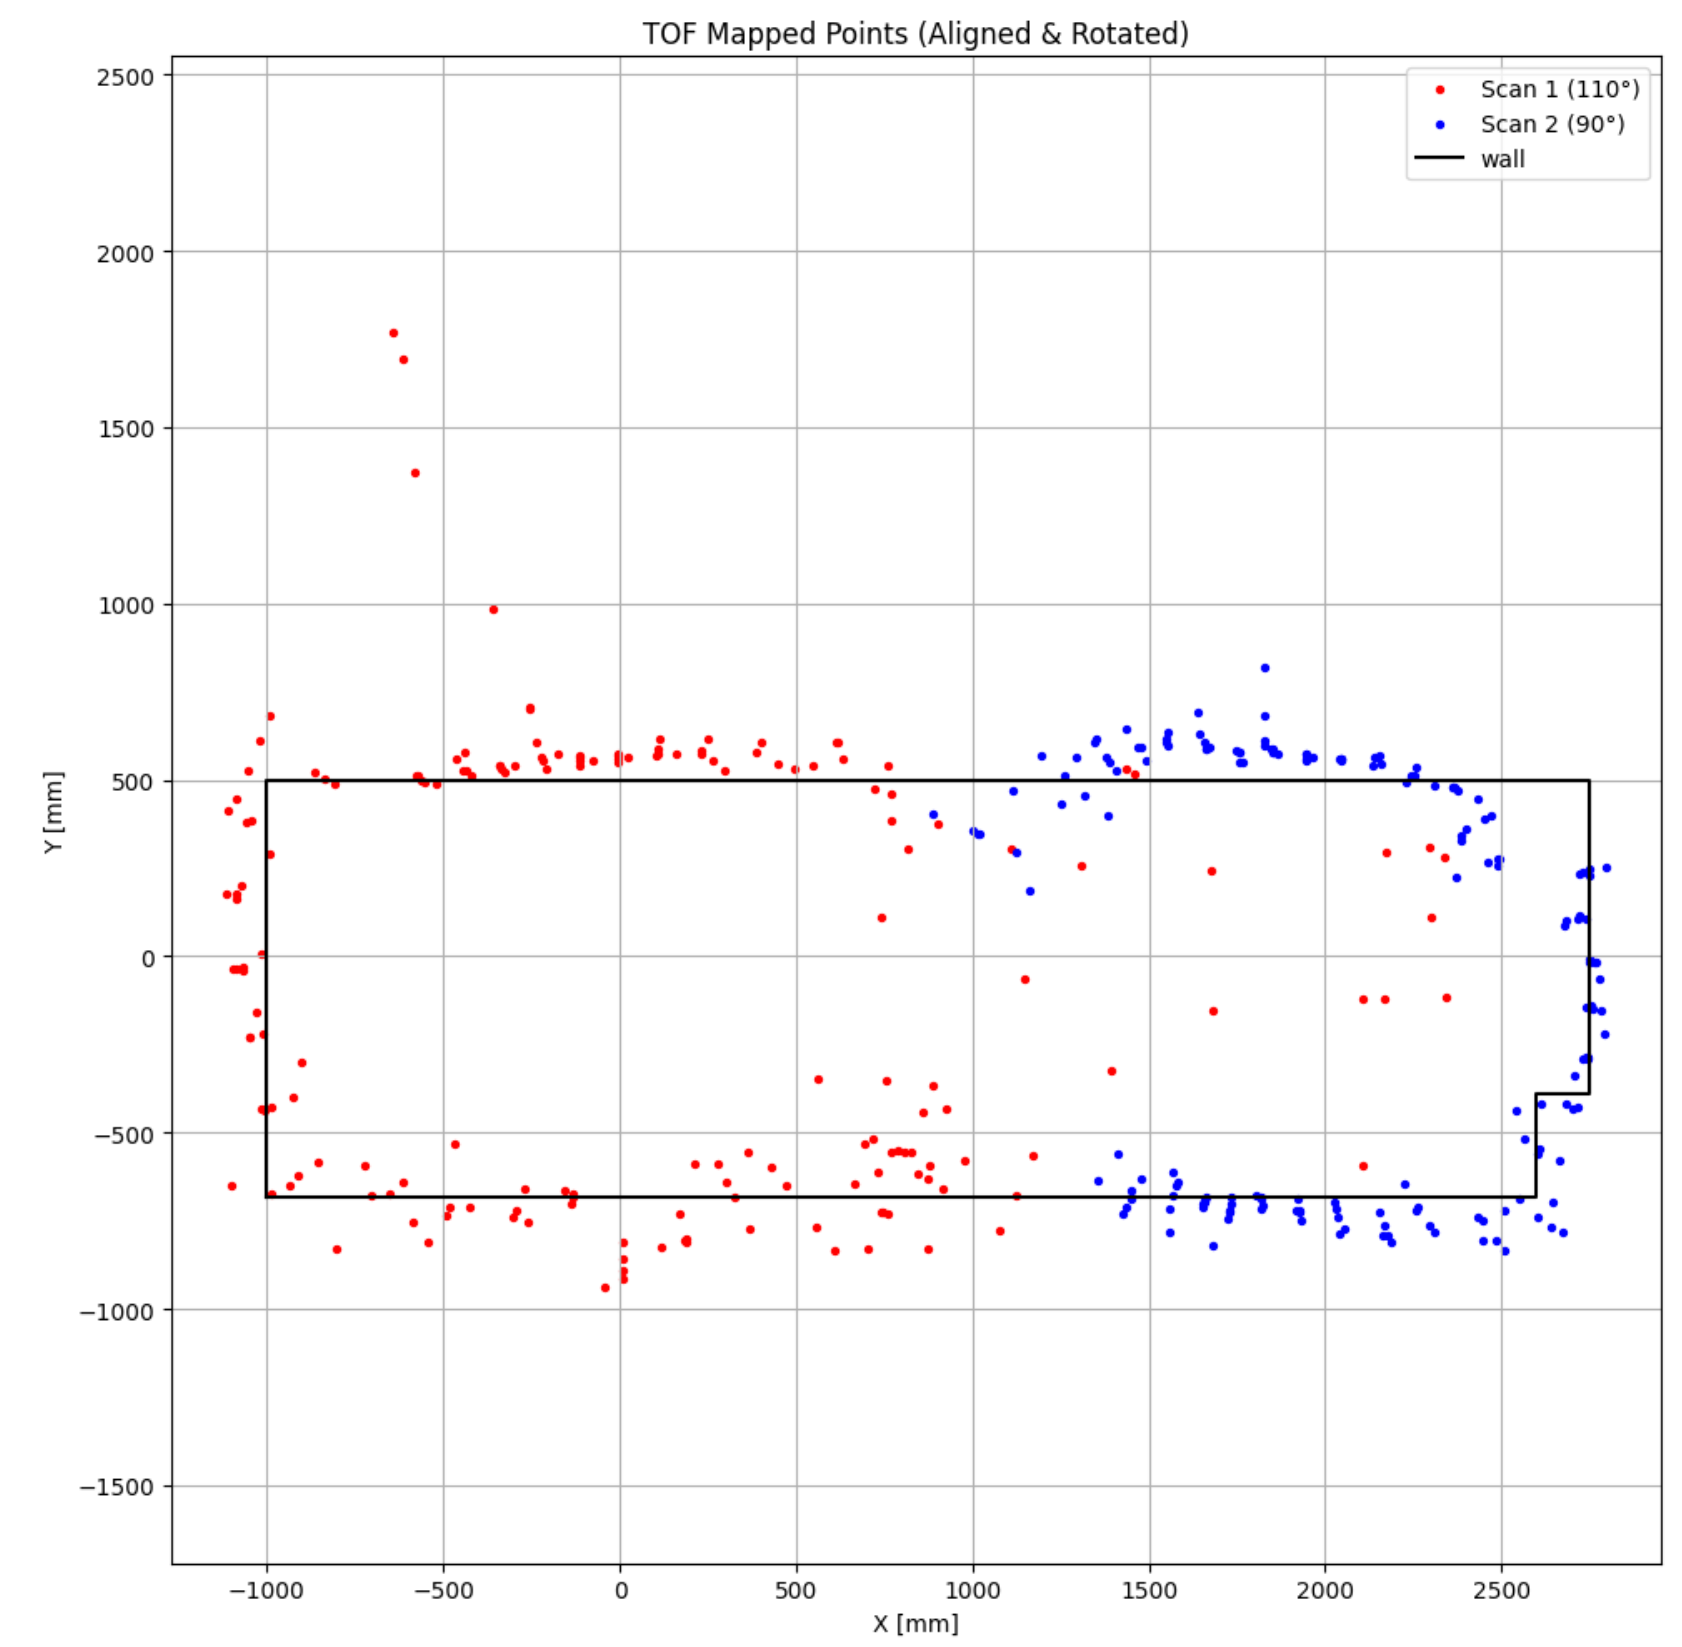
Figure 11: Mapped Scatterplot with walls
I then used a tape measure to wall dimensions based off of robot starting positions and scatterplot data.
Another thing I noticed was that I had to rotate both of my data sets. I expected this since the initial orientation is unlikely to carry through. However, I was surprise that the rotation was different for two sets. It seemed off by roughly 20 degrees. I suspect this may be due to some drift, differing initial placement, or some combination of both.
import pandas as pd
import numpy as np
import matplotlib.pyplot as plt

# === Constants ===
INCH_TO_MM = 25.4
GRID_UNIT = 12 * INCH_TO_MM  # 1 grid unit = 12 inches = 304.8 mm

def load_and_transform(filepath, offset_x, offset_y, rotation_deg=0):
    # Load CSV
    df = pd.read_csv(filepath, skiprows=1, names=["time", "yaw", "tof"])
    df = df.astype({"time": float, "yaw": float, "tof": float})

    # Convert to radians
    angles_rad = np.deg2rad(df["yaw"].values)
    distances = df["tof"].values

    # Polar to Cartesian
    x = distances * np.cos(angles_rad)
    y = distances * np.sin(angles_rad)

    coords = np.vstack((x, y))

    # === Apply rotation ===
    if rotation_deg != 0:
        theta = np.deg2rad(rotation_deg)
        rot_matrix = np.array([
            [np.cos(theta), -np.sin(theta)],
            [np.sin(theta),  np.cos(theta)]
        ])
        coords = rot_matrix @ coords

    # === Apply translation ===
    coords[0] += offset_x * GRID_UNIT
    coords[1] += offset_y * GRID_UNIT

    return coords[0], coords[1]  # x, y

x1, y1 = load_and_transform("scan1.csv", offset_x=0, offset_y=0, rotation_deg=110)
x2, y2 = load_and_transform("scan2.csv", offset_x=6, offset_y=0, rotation_deg=90)

wallx = [-1000, 2600, 2600, 2750, 2750, -1000, -1000]
wally = [-685, -685, -390, -390, 500, 500, -685]

# === Plot ===
plt.figure(figsize=(10, 10))
plt.scatter(x1, y1, c='red', label="Scan 1 (110°)", s=8)
plt.scatter(x2, y2, c='blue', label="Scan 2 (90°)", s=8)
plt.plot(wallx, wally, c='black', label="wall")

plt.xlabel("X [mm]")
plt.ylabel("Y [mm]")
plt.title("TOF Mapped Points (Aligned & Rotated)")
plt.legend()
plt.axis("equal")
plt.grid(True)
plt.tight_layout()
plt.show()
Figure 13: Mapped Scatterplot with Walls Code